How Slow Page Load Time Kills Bounce Rate (And Your Revenue)

When I rebuild websites for clients, the first thing I check isn't their design or copy — it's their load time. In the past year alone, I've seen businesses lose thousands in revenue simply because their pages take 4-5 seconds to load instead of 2-3 seconds. Understanding how slow page load time affects bounce rate isn't just about user experience anymore; it's about your bottom line.
The relationship between page speed and visitor behavior follows predictable patterns. Yet most business owners still treat slow loading times as a minor inconvenience rather than what it actually is: a revenue leak that compounds every single day.
The Direct Link: How Page Load Time Drives Bounce Rate
Bounce rate measures the percentage of visitors who leave your site after viewing only one page. But here's what that really means for your business: these are potential customers who never gave you a chance to make your case.
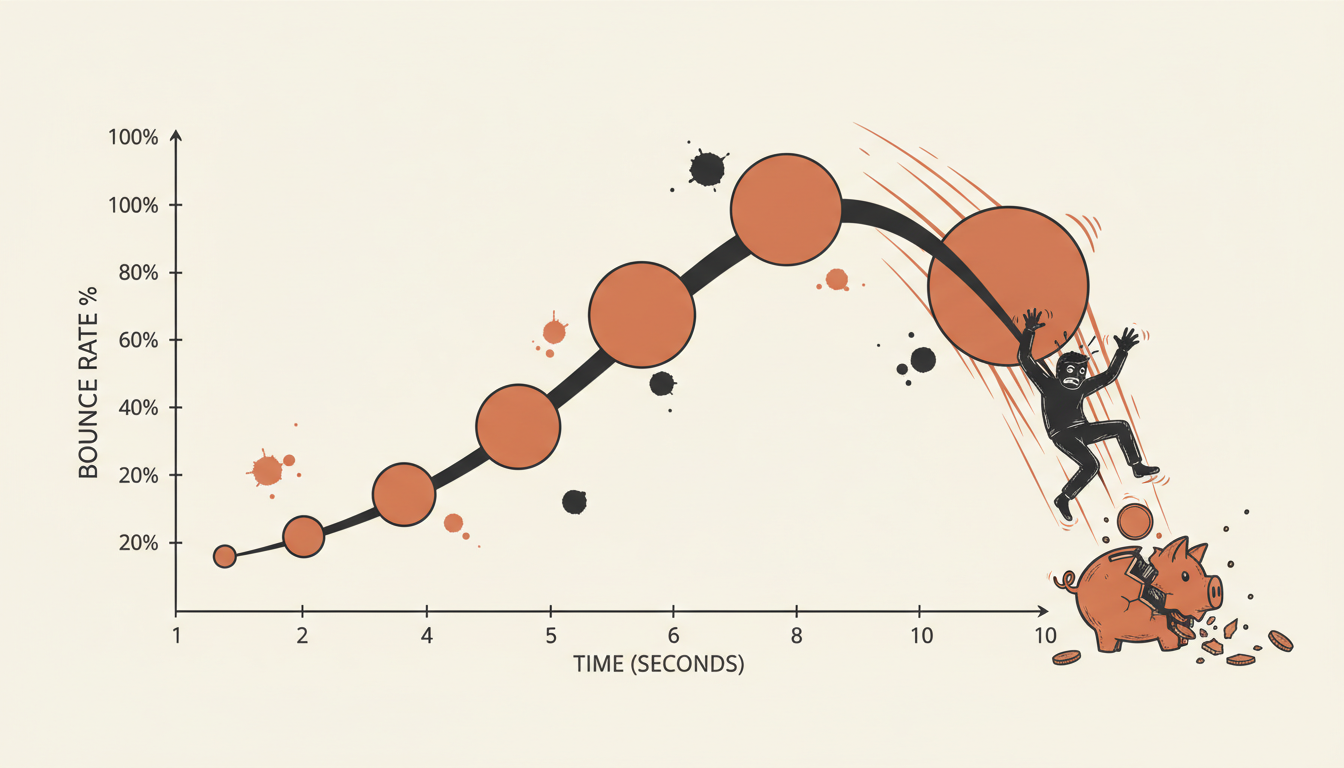
From a 1 to 3 second page load time, the probability of a bounce increases 32% according to Google's 2024 research. This isn't a gradual decline — it's a cliff that most websites fall off without realizing it.
The psychology behind this is straightforward. When someone clicks on your website, they're making a micro-commitment. They've decided your site might solve their problem. But if your page doesn't load within their attention window, that commitment evaporates.
On desktop, users might tolerate 3-4 seconds if your content looks promising. On mobile, that tolerance drops dramatically. 53% of mobile visitors will leave if a page takes longer than 3 seconds to load, and mobile now represents the majority of web traffic for most businesses.
| Load Time | Bounce Rate | User Tolerance |
|---|---|---|
| 1 second | 9% | Excellent |
| 2 seconds | 15% | Good |
| 3 seconds | 38% | Acceptable |
| 5 seconds | 73% | Poor |
| 10+ seconds | 90%+ | Unacceptable |
These aren't arbitrary numbers. They represent real human behavior patterns that I've observed across hundreds of client websites. The 3-second threshold isn't a suggestion — it's a business requirement.
The Numbers That Matter: Real Performance Thresholds
Let me give you the specific benchmarks that separate successful websites from struggling ones. Sites loading in 1 second achieve 39% conversion rates, while this drops to 1.9% at 2.4 seconds and plummets to 0.6% at 5.7 seconds according to Portent's comprehensive 2024 study.
Think about those numbers for a moment. A site loading in under a second converts visitors at 39%. The same site, loading at 6 seconds, converts at less than 1%. That's not a gradual decline — it's a conversion collapse.
For B2B businesses, the stakes are even higher. A B2B site that loads in 1 second has a conversion rate 3x higher than a site that loads in 5 seconds. When you're dealing with higher-value transactions and longer sales cycles, every lost visitor represents significant opportunity cost.
The mobile-specific data tells an even more urgent story. Mobile users aren't just less patient — they're operating in entirely different contexts. They might be on slower connections, in crowded areas, or trying to complete tasks between other activities.
Industry benchmarks vary, but here's what I tell clients to aim for: under 2.5 seconds on mobile, under 2 seconds on desktop. These aren't perfectionist targets — they're business necessities in 2026.
The Revenue Impact: Converting Bounce Rate to Bottom Line
Let's translate bounce rates into actual revenue impact. I recently worked with a client generating $100,000 annually through their website. Their average page load time was 4.2 seconds, resulting in a 65% bounce rate.
Here's the math: if 1,000 visitors per month were bouncing instead of converting, and their average order value was $200 with a 5% conversion rate, they were losing approximately $1,000 monthly — $12,000 annually — just to slow load times.
After optimization, we reduced their load time to 2.1 seconds, dropping bounce rate to 28%. The revenue increase was immediate and measurable.
| Annual Revenue | High Bounce Rate (65%) | Optimized Bounce Rate (28%) | Annual Loss |
|---|---|---|---|
| $50,000 | $32,500 | $46,400 | $13,900 |
| $100,000 | $65,000 | $92,800 | $27,800 |
| $250,000 | $162,500 | $232,000 | $69,500 |
| $500,000 | $325,000 | $464,000 | $139,000 |
Online businesses lost nearly $2.6 billion in revenue because of slow loading speed according to 2024 industry research. Your business might represent a tiny fraction of that number, but for you, it's 100% of your opportunity cost.
The long-term impact extends beyond immediate lost sales. High bounce rates signal poor user experience to search engines, potentially affecting your rankings and organic visibility. You're not just losing today's visitors — you're making it harder to attract tomorrow's.
Beyond Statistics: Why Humans Bounce From Slow Sites
Understanding the psychology behind bounces helps you see why page speed optimization isn't just a technical exercise — it's a trust-building exercise.
When someone visits your slow-loading site, they're not thinking about your server infrastructure or image compression. They're thinking: "Does this business have their act together?" A slow site suggests poor attention to detail, outdated technology, or simply not caring about user experience.
Cognitive load plays a huge role here. Every second of loading time requires visitors to maintain their intention and resist the urge to click back or visit a competitor. In our attention-deficit digital environment, that's asking a lot.
Mobile users face additional context challenges. They might be comparison shopping, researching on the go, or trying to solve an urgent problem. A slow-loading site isn't just inconvenient — it's actively preventing them from accomplishing their goal.
Competition amplifies this effect. If your competitor's site loads in 2 seconds and yours loads in 5, the choice becomes obvious. Speed becomes a competitive differentiator, whether you're actively competing on it or not.
Webflow-Specific Strategies to Slash Bounce Rates
Webflow gives you significant advantages for page speed optimization, but only if you use its features correctly. I've optimized dozens of Webflow sites, and the biggest improvements come from understanding the platform's strengths.
Start with Webflow's native image optimization. Enable responsive images and lazy loading from the project settings. This alone can reduce initial load times by 30-40% on image-heavy sites. But don't stop there — optimize your source images before upload. Even Webflow's compression has limits.
Webflow hosting includes a global CDN, but you need to structure your content to take advantage of it. Keep your above-the-fold content lightweight and defer non-critical elements. I typically aim for under 1MB for everything that loads initially.
Custom code placement matters enormously in Webflow. Any JavaScript in the head section blocks rendering. Move analytics, chat widgets, and non-essential scripts to the footer or use async loading. The difference is measurable — often 0.5-1 second improvement in perceived load time.
Webflow interactions can hurt performance if timed incorrectly. Avoid complex animations on page load — they delay content visibility and increase bounce risk. Save sophisticated interactions for user-triggered events after the page loads completely.
For clients needing enterprise-level performance, I sometimes recommend external CDNs like Cloudflare Pro in addition to Webflow's hosting. The combination can push load times under 1.5 seconds globally, which dramatically improves page speed bounce rate performance.
WordPress and Shopify: Platform-Specific Quick Wins
WordPress and Shopify require different optimization approaches due to their plugin ecosystems and hosting variations. I've learned that platform-specific strategies yield much better results than generic advice.
For WordPress sites, your theme choice determines 70% of your baseline performance. I always recommend auditing Core Web Vitals before selecting themes. Many popular themes are performance disasters disguised as beautiful designs.
Plugin management becomes critical for load time conversion rate optimization. Each plugin adds overhead, but some are worth their performance cost. Essential plugins: caching (WP Rocket), image optimization (ShortPixel), and CDN (Cloudflare). Avoid: page builders on the frontend, excessive social media widgets, and redundant SEO plugins.
Shopify has unique e-commerce challenges. Product images, customer reviews, and checkout flows all impact bounce rates differently. I focus on above-the-fold optimization for product pages and streamlined checkout processes that load under 2 seconds on mobile.
| Platform | Primary Strategy | Expected Improvement | Time Investment |
|---|---|---|---|
| WordPress | Theme optimization + caching | 40-60% load time reduction | 4-6 hours |
| Shopify | Product image optimization | 30-45% mobile improvement | 3-4 hours |
| Webflow | Native feature utilization | 50-70% performance gain | 2-3 hours |
| Custom | Server-level optimization | 60-80% improvement possible | 8-12 hours |
Hosting provider selection dramatically affects WordPress performance. Shared hosting might cost $5 monthly, but managed WordPress hosting at $25 monthly often provides 3-4x better load times. For businesses generating revenue through their website, this cost difference pays for itself within weeks.
Shopify Plus customers have access to advanced optimization features that significantly impact website speed optimization. Script loading control, advanced caching, and CDN configuration can push Shopify sites to sub-2-second load times.
Measuring Success: Beyond Bounce Rate Metrics
Bounce rate tells you what's happening, but you need additional metrics to understand why and track improvement accurately. I use a combination of tools and metrics that give clients a complete performance picture.
Core Web Vitals serve as leading indicators for bounce rate changes. Largest Contentful Paint (LCP) directly correlates with user patience. When LCP exceeds 2.5 seconds, bounce rates climb predictably. Cumulative Layout Shift (CLS) affects trust — pages that jump around feel broken, even if they load quickly.
Image optimization often provides the biggest Core Web Vitals improvements, which translates directly to better bounce rates and conversion performance.
Revenue per visitor tracks the business impact of your optimizations. This metric combines conversion rate, average order value, and traffic quality. Even if bounce rate only improves by 10%, revenue per visitor might increase by 25% due to better-qualified remaining traffic.
Time on site and pages per session indicate engagement quality. Sometimes bounce rate stays stable while these metrics improve significantly — users are staying longer and exploring more, even if total bounce rate hasn't changed. This often precedes conversion rate improvements.
For ongoing monitoring, I recommend Google PageSpeed Insights for monthly checks and GTmetrix for detailed technical analysis. Both are free and provide actionable recommendations. Avoid getting obsessed with perfect scores — focus on consistent improvement and real-world impact.
Most small businesses don't need expensive monitoring tools. Google Search Console shows Core Web Vitals data for your actual visitors, which matters more than synthetic test results. If Search Console shows good performance, your optimization efforts are working.
Remember that how slow page load time affects bounce rate varies by industry and audience. B2B professional services visitors might tolerate slightly longer load times than e-commerce shoppers. Test your specific situation rather than relying entirely on industry benchmarks.
The goal isn't perfection — it's competitive advantage. If your site loads in 2.5 seconds and your competitor's loads in 4 seconds, you win those head-to-head comparisons consistently. Small improvements compound into significant business advantages over time.
Quick wins exist on every platform. Start with image optimization and basic caching. These improvements require minimal technical expertise but deliver measurable results within days. Once you see the revenue impact, investing in more sophisticated optimizations becomes an obvious business decision.
Need help identifying the specific optimizations that will impact your bounce rate most? Get a detailed performance audit that shows exactly where your site is losing visitors and revenue.
Let's talk about your website
I offer a free 45-minute strategy call where we look at your current site, identify quick wins, and map out a plan — no strings attached.
Book a Free Strategy Call →